GODXBT Scalper 15minGodxbt scalper is specifically designed for short term trades on 15min timeframe
This indicator is based on price action
What this indicator includes:
1) BULL,BEAR signals based on price action
2) 3 EMA(exponential moving average) for the market trend/direction .
3) take profits points ( based on oscillators ) shows overbought and oversold conditions.
How to trade :
This indicator works on 15min timeframe the parameters for the indicator is locked for 15min timeframe
***Important: Signal confirms on bar close
1) “BULL” signal shows buying opportunity
Buys are more profitable than sells if EMA ribbon is blue which means bullish trend (buyers are in control)
2) “BEAR” signal shows selling opportunity
Sells are more profitable when EMA ribbon is red which means bearish trend (sellers are in control)
3) TP+ and TP- appears below and above candles it shows the potential reversal points for the price action
There you should take some profits off the trade
Ema ribbon shows market trend
Default ema inputs are set on 20 and 50 (you can add your own sets of ema by changing the input )
Blue ribbon is bullish trend which also acts as a support
Red ribbon is bearish trend which also acts as a resistance
You can use ribbon to add stoploss below and above the ribbon
222 EMA for strong support and resistance
DM for the access
在脚本中搜索"take profit"

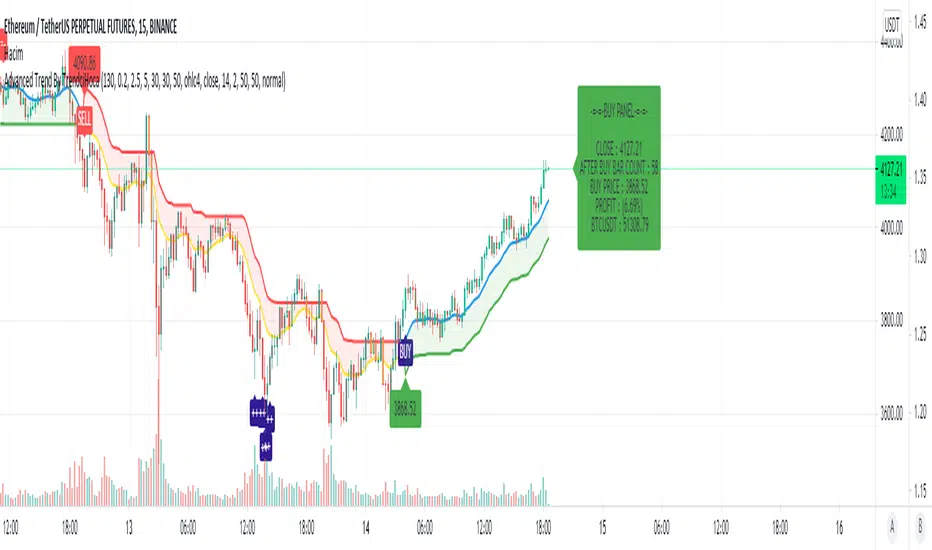
Advanced Trend By TrendciHocaMany people want to earn more while earning. But sometimes terminating can bring more profit. The meaning of the flag symbols on the graph means if you want the minus symbol that comes when the trend is up, take profit, the minus symbol that comes when the trend is down means take profit again. Sometimes these signals can allow you to get more profit. This indicator prepared for one hour period but if you want you can use all period. You can also have info panel that shows you how much percent of your last buy or sell profit. You can use all stocks and coins.
Bollinger Band Width PercentileIntroducing the Bollinger Band Width Percentile
Definitions :
Bollinger Band Width Percentile is derived from the Bollinger Band Width indicator.
It shows the percentage of bars over a specified lookback period that the Bollinger Band Width was less than the current Bollinger Band Width.
Bollinger Band Width is derived from the Bollinger Bands® indicator.
It quantitatively measures the width between the Upper and Lower Bands of the Bollinger Bands.
Bollinger Bands® is a volatility-based indicator.
It consists of three lines which are plotted in relation to a security's price.
The Middle Line is typically a Simple Moving Average.
The Upper and Lower Bands are typically 2 standard deviations above, and below the SMA (Middle Line).
Volatility is a statistical measure of the dispersion of returns for a given security or market index, measured by the standard deviation of logarithmic returns.
The Broad Concept :
Quoting Tradingview specifically for commonly noted limitations of the BBW indicator which I have based this indicator on....
“ Bollinger Bands Width (BBW) outputs a Percentage Difference between the Upper Band and the Lower Band.
This value is used to define the narrowness of the bands.
What needs to be understood however is that a trader cannot simply look at the BBW value and determine if the Band is truly narrow or not.
The significance of an instruments relative narrowness changes depending on the instrument or security in question.
What is considered narrow for one security may not be for another.
What is considered narrow for one security may even change within the scope of the same security depending on the timeframe.
In order to accurately gauge the significance of a narrowing of the bands, a technical analyst will need to research past BBW fluctuations and price performance to increase trading accuracy. ”
Here I present the Bollinger Band Width Percentile as a refinement of the BBW to somewhat overcome the limitations cited above.
Much of the work researching past BBW fluctuations, and making relative comparisons is done naturally by calculating the Bollinger Band Width Percentile.
This calculation also means that it can be read in a similar fashion across assets, greatly simplifying the interpretation of it.
Plotted Components of the Bollinger Band Width Percentile indicator :
Scale High
Mid Line
Scale Low
BBWP plot
Moving Average 1
Moving Average 2
Extreme High Alert
Extreme Low Alert
Bollinger Band Width Percentile Properties:
BBWP Length
The time period to be used in calculating the Moving average which creates the Basis for the BBW component of the BBWP.
Basis Type
The type of moving average to be used as the Basis for the BBW component of the BBWP.
BBWP Lookback
The lookback period to be used in calculating the BBWP itself.
BBWP Plot settings
The BBWP plot settings give a choice between a user defined solid color, and a choice of "Blue Green Red", or "Blue Red" spectrum palettes.
Moving Averages
Has 2 Optional User definable and adjustable moving averages of the BBWP.
Visual Alerts
Optional User adjustable High and low Signal columns.
How to read the BBWP :
A BBWP read of 95 % ... means that the current BBW level is greater than 95% of the lookback period.
A BBWP read of 5 % .... means that the current BBW level is lower than 95% of the lookback period.
Proposed interpretations :
When the BBWP gets above 90 % and particularly when it hits 100% ... this can be a signal that volatility is reaching a maximum and that a macro High or Low is about to be set.
When the BBWP gets below 10 % and particularly when it hits 0% ...... this can be a signal that volatility is reaching a minimum and that there could be a violent range breakout into a trending move.
When the BBWP hits a low level < 5 % and then gets above its moving average ...... this can be an early signal that a consolidation phase is ending and a trending move is beginning.
When the BBWP hits a high level > 95 % and then falls below its moving average ... this can be an early signal that a trending move is ending and a consolidation phase is beginning.
Essential knowledge :
The BBWP was designed with the daily timeframe in mind, but technical analysists may find use for it on other time frames also.
High and Low BBWP readings do not entail any direction bias.
Deeper Concepts :
In finance, “mean reversion” is the assumption that a financial instrument's price will tend to move towards the average price over time.
If we apply that same logic to volatility as represented here by the Bollinger band width percentile, the assumption is that the Bollinger band width percentile will tend to contract from extreme highs, and expand from extreme lows over time corresponding to repeated phases of contraction and expansion of volatility.
It is clear that for most assets there are periods of directional trending behavior followed by periods of “consolidation” ( trading sideways in a range ).
This often ends with a tightening range under reducing volume and volatility ( popularly known as “the squeeze” ).
The squeeze typically ends with a “breakout” from the range characterized by a rapid increase in volume, and volatility when price action again trends directionally, and the cycle repeats.
Typical Use Cases :
The Bollinger Band Width Percentile may be especially useful for Options traders, as it can provide a bias for when Options are relatively expensive, or inexpensive from a Volatility (Vega) perspective.
When the Bollinger Band Width Percentile is relatively high ( 85 percentile or above ) it may be more advantageous to be a net seller of Vega.
When the Bollinger Band Width Percentile is relatively low ( 15 percentile or below ) it may be advantageous to be net long Vega.
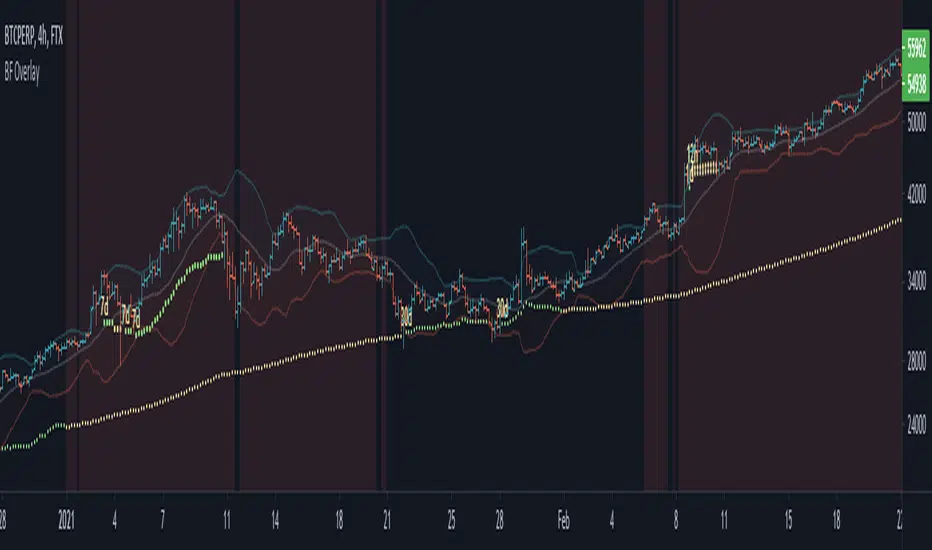
Here we examine a number of actionable signals on BTCUSD daily timeframe using the BBWP and a momentum oscillator ( using the TSI here but can equally be used with Bollinger bands, moving averages, or the traders preferred momentum oscillator ).
In this first case we will examine how a spot trader and an options trader could each use a low BBWP read to alert them to a good potential trade setup.
note: using a period of 30 for both the Bollinger bands and the BBWP period ( approximately a month ) and a BBWP lookback of 350 ( approximately a year )
As we see the Bollinger Bands have gradually contracted while price action trended down and the BBWP also fell consistently while below its moving average ( denoting falling volatility ) down to an extremely low level <5% until it broke above its moving average along with a break of range to the upside ( signaling the end of the consolidation at a low level and the beginning of a new trending move to the upside with expanding volatility).
In this next case we will continue to follow the price action presuming that the traders have taken or locked in profit at reasonable take profit levels from the previous trade setup.
Here we see the contraction of the Bollinger bands, and the BBWP alongside price action breaking below the BB Basis giving a warning that the trending move to the upside is likely over.
We then see the BBWP rising and getting above its moving average while price action fails to get above the BB Basis, likewise the TSI fails to get above its signal line and actually crosses below its zeroline.
The trader would normally take this as a signal that the next trending move could be to the downside.
The next trending move turns out to be a dramatic downside move which causes the BBWP to hit 100% signaling that volatility is likely to hit a maximum giving good opportunities for profitable trades to the skilled trader as outlined.
Limitations :
Here we will look at 2 cases where blindly taking BBWP signals could cause the trader to take a failed trade.
In this first example we will look at blindly taking a low volatility options trade
Low Volatility and corresponding low BBWP levels do not automatically mean there has to be expansion immediately, these periods of extreme low volatility can go on for quite some time.
In this second example we will look at blindly taking a high volatility spot short trade
High volatility and corresponding high BBWP levels do not automatically mean there has to be a macro high and contraction of volatility immediately, these periods of extreme high volatility can also go on for quite some time, hence the famous saying "The trend is your friend until the end of the trend" and lesser well known, but equally valid saying "never try to short the top of a parabolic blow off top"
Markets are variable and past performance is no guarantee of future results, this is not financial advice, I am not a financial advisor.
Final thoughts
The BBWP is an improvement over the BBW in my opinion, and is a novel, and useful addition to a Technical Analysts toolkit.
It is not a standalone indicator and is meant to be used in conjunction with other tools for direction bias, and Good Risk Management to base sound trades off.
John Bollinger has suggested using Bolliger bands, and its related indicators with two or three other non-correlated indicators that provide more direct market signals.
He believes it is crucial to use indicators based on different types of data.
Some of his favored technical techniques are moving average divergence/convergence (MACD), on-balance volume and relative strength index (RSI).
Thanks
Massive respect to John Bollinger, long-time technician of the markets, and legendary creator of both the Bollinger Bands® in the 1980´s, and the Bollinger band Width indicator in 2010 which this indicator is based on.
His work continues to inspire, decades after he brought the original Bollinger Bands to the market.
Much respect also to Eric Crown who gave me the fundamental knowledge of Technical Analysis, and Options trading.

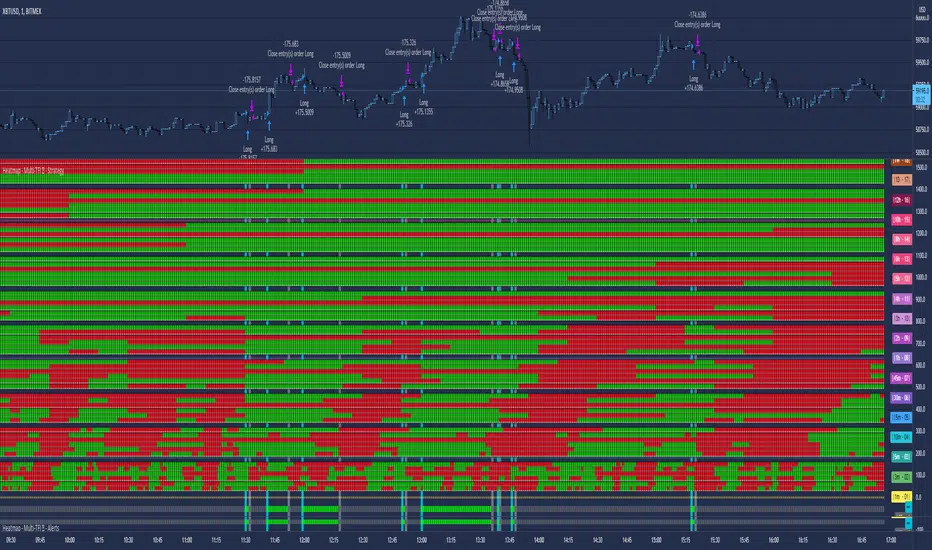
Heatmap - Multi-Timeframe Indicators - AlertsHeatmap - Multi-Timeframe Indicators - Alerts
▪ Main features :
- 19 Timeframes: 1m, 3m, 5m, 10m, 15m, 30m, 45m, 1h, 2h, 3h, 4h, 5h, 6h, 8h, 10h, 12h, 1D, 1W, 1M
- 6 indicators per timeframe
- choose specific timeframes for indicators (example - 1 hour)
- or choose specific timeframe ranges (example - 1 hour to 1 month)
The general idea is that the higher timeframe signals are stronger than the lower timeframe ones.
When a trend is starting, it is first visible on the lower timeframes.
The more time passes, the more the trend propagates through higher timeframes.
The default settings are meant to show all the available features. You may fine-tune it to your specific needs.
How to choose the timeframe for the chart : use the lowest of the choosen timeframes for indicators.
If the heatmap doesn't display correctly on your device, you may check the Heatmap Theme 🎨 setting.
It doesn't repaint.
"Repaint" version available though - good to check the past history, but very bad for real-time analysis.
▪ Indicators used for trend detection
1. MACD Cross
2. Stochastic Cross
3. Stochastic Cross and Overbought or Oversold
4. Moving Average
5. Parabolic SAR
6. Heikin Ashi
▪ Find the best Heatmap settings with the Strategy Tester version.
The signals generated by the Heatmap are considered to be valid at the bar open .
The Strategy Tester, however, uses the bar close in its calculations.
Therefore, the results may seem to be worse than they can be.
The Profitability, Profit Factor and other stats should be taken into consideration relatively to other configurations of the same Heatmap.
▪ Using a score system to consider a change in trend valid.
Example: consider the signal valid if 65% or more of all indicators (max 6) among all timeframes (max 19) hint at a change in trend.
The % percent value can be inserted in settings.
When using the default settings or when all timeframes and indicators are activated,
the ratio of 100% downtrend or 100% uptrend may be less occuring. Adjust accordingly.
The signals across timeframes and indicators are aggregated to show simple entry and exit signals.
▪ Combined Alerts, to be set to fire once per bar open :
0 - 📈 Long! - Heatmap - Multi-TFI
0 - 📈 Short! - Heatmap - Multi-TFI
0 - 📈 Long Exit! - Heatmap - Multi-TFI
0 - 📈 Short Exit! - Heatmap - Multi-TFI
1 *** BUY or SELL (single alert) ***
1 *** Entries or Exits (single alert) ***
▪ Note : The initial load may be slow. If something doesn't seem to work, you can try the following:
- wait more time for it to load
- hide & show or remove & add back to chart
- don't add the indicator to chart multiple times in a short amount of time, as you may be rate limited
▪ Related Studies :
- Heatmap - Multi-Timeframe Indicators - Strategy Tester
- Risk Management System (Stop Loss, Take Profit, Trailing Stop Loss, Trailing Take Profit) - it can be connected to Heatmap - Multi-Timeframe Indicators - Alerts
▪ Layout example:
Impact Zones - Skylyne InvestingWhat is the Impact Zone system:
The creation of Impact Zones started with our love for trading the Bond Market. Impact Zones were originally specifically tailored for the Bond market and now have been mastered to capture most of the Asset Classes out in the market today (Please look at Impact Zone Settings section for asset classes covered by this script). The Impact Zone system is a zone break (or market level break) following system with specific take profit points already established for you on the open of the market day (depending on your asset timing will vary).
*This script was designed for Intraday Trading, Long term or Swing Trading is not recommended with this system
The script will create buy and sell signals on the break of the Impact Zones when specific criteria is met along with the break of the zone. You do not have to use only our signals provided, you can also create your own trading rules based on our script.
Items to highlight:
Skylyne Upper Zone: Green Zone
Skylyne Middle: Yellow Line
Skylyne Lower Zone: Red Zone
Skylyne Take Profit Lines: Purple Lines
Skylyne Average: Orange Line (dynamic support/resistance)
Skylyne Overnight Session: Dark Blue (No Trade Zones)
Skylyne Signals: Buy / Sell
You can think of the Upper Zone as a bull zone and Lower zone as a bear zone, when price enters these zones we want to start watching price action to determine direction the market will take on the break or specified zone, whether it be a break and reversal or a break and run. This can be confirmed with either our signals (buy & sell) or the use of the dynamic support and resistance line (Skylyne Average).
Our script is written to capture market zones and place then on your screen with ease, we also have programmed in specific take profits and stop loss levels we have found the market respects on the intraday trading based on the Impact Zone captured.
The Impact Zones and Take Profit Levels change at Market open everyday. The levels provided will stay on your chart until the next Market open where the Impact Zones and Levels will change to accommodate that trading Day.
We recommend only using that trading days levels, however; using past levels can help trades depending on the case
The three Trades we want to highlight are:
1. Break of Impact Zones
a. This trade is taken when a break of the impact zone happens either in the positive or negative direction and traded to the next zone or take profit line (stop losses can be set with zones or the dynamic skylyne average crossovers)
2. Break of Skylyne Average
a. This trade is taken when price action confirms a bullish or bearish bias on the break of the average line (we would close this trade on the reverse break of the Skylyne Average using the zones as targets)
3. Break of the Skylyne Mid:
a. This trade is taken when a break of the Skylyne Mid level occurs and we use the upper and lower bounds of the Impact Zones as take profit and stop losses
Impact Zone Settings:
*Trading Category and Overnight Category must match the Asset Class being viewed on chart for accurate signals
1. Trading Category
a. Bonds
b. Corn/Wheat
c. Stocks
d. Index Futures
e. Euro/Dollar
f. Gold/Silver
2. Overnight Category
a. Bonds
b. Corn/Wheat
c. Stocks
d. Index Futures
e. Euro/Dollar
f. Gold/Silver
3. Chart Aggregation Limit (Default Value is 25 minutes)
Impact Zone Overnight Trading:
Impact Zone Overnight sessions are highlighted in a dark blue color and we use these highlighted time sessions as a NO TRADE session. Our system was built to be traded during normal market trading hours and overnight sessions tend to be less predictive in terms of direction and or zone reliance. If you choose to trade overnight sessions with Impact Zones, make sure you make a very in depth trading plan and stick to the rules set for yourself.
Impact Zone Signals:
1. Signals for buy or sell of the asset class happen on breaks of the Impact Zones, and when specific criteria are met that we determined necessary to evaluate the overall trend of the market
2. Not every break of the Impact Zones will trigger a signal
3. No signal will be generated during overnight sessions, we recommend studying overnight sessions before beginning to create your own overnight trading session plans based on Impact Zones
4. When a signal is generated you will use the next take profit line (purple line) in the direction of your trade you are in. Other trading signals were discussed above
5. If while you are in a trade and the skylyne average (orange line) is broke in the opposite direction of your trade you will take this as a dynamic stop, and in some cases a dynamic take profit
Impact Zone Charting Timeframes:
1. Recommendation of using the 1 minute chart aggregation bars to maximize profits and limit losses
2. The script has a default charting aggregation limit of 25 minutes, adjustments to the input (in the settings) to increase the aggregation limit need to be made in order to use higher than 25 minute timeframes
Charting Example:
First note is to notice how our publish example uses the 1-minute timeframe aggregation, this is because our script was written to maximize profit on the 1 minute time frame. The script can be used on any time frame, however; make sure that you increase the aggregation limit input when using timeframes above 25 minutes.
From the chart included in the script post, you can notice that buy and sell signals happen only when specified criteria is met, and not every time there is a crossover of the Impact Zones there is a signal. You do not only have to trade the buy and sell signals that our system provides, however; our team believes that these signals are one of the best ways to trade the Impact Zone script. If you deviate from only using signals provided and choose to use the Impact Zones differently, we recommend using the next level, or zone, in the direction of your trade as your take profit (As described in trade we want to highlight section)

Risk Management: Position Size & Risk RewardHere is a Risk Management Indicator that calculates stop loss and position sizing based on the volatility of the stock. Most traders use a basic 1 or 2% Risk Rule, where they will not risk more than 1 or 2% of their capital on any one trade. I went further and applied four levels of risk: 0.25%, 0.50%, 1% and 2%. How you apply these different levels of risk is what makes this indicator extremely useful. Here are some common ways to apply this script:
• If the stock is extremely volatile and has a better than 50% chance of hitting the stop loss, then risk only 0.25% of your capital on that trade.
• If a stock has low volatility and has less than 20% change of hitting the stop loss, then risk 2% of your capital on that trade.
• Risking anywhere between 0.25% and 2% is purely based on your intuition and assessment of the market.
• If you are on a losing streak and you want to cut back on your position sizing, then lowering the Risk % can help you weather the storm.
• If you are on a winning streak and your entries are experiencing a higher level of success, then gradually increase the Risk % to reap bigger profits.
• If you want to trade outside the noise of the market or take on more noise/risk, you can adjust the ATR Factor.
• … and whatever else you can imagine using it to benefit your trading.
The position size is calculated using the Capital and Risk % fields, which is the percentage of your total trading capital (a.k.a net liquidity or Capital at Risk). If you instead want to calculate the position size based on a specific amount of money, then enter the amount in the Custom Risk Amt input box. Any amount greater than 0 in the Custom Risk Amt field will override the values in the Capital and Risk % fields.
The stop loss is calculated by using the ATR. The default setting is the 14 RMA, but you can change the length and smoothing of the true range moving average to your liking. Selecting a different length and smoothing affects the stop loss and position size, so choose these values very carefully.
The ATR Factor is a multiplier of the ATR. The ATR Factor can be used to adjust the stop loss and move it outside of the market noise. For the more volatile stock, increase the factor to lower the stop loss and reduce the chance of getting stopped out. For stocks with less volatility , you can lower the factor to raise the stop loss and increase position size. Adjusting the ATR Factor can also be useful when you want the stop loss to be at or below key levels of support.
The Market Session is the hours the market is open. The Market Session only affects the Opening Range Breakout (ORB) option, so it’s important to change these values if you’re trading the ORB and you’re outside of Eastern Standard Time or you’re trading in a foreign exchange.
The ORB is a bonus to the script. When enabled, the indicator will only appear in the first green candle of the day (09:30:00 or 09:30 AM EST or the start time specified in Market Session). When using the ORB, the stop loss is based on the spread of the first candle at the Open. The spread is the difference between the High and Low of the green candle. On 1-day or higher timeframes, the indicator will be the spread of the last (or current) candle.
The output of the indicator is a label overlaying the chart:
1. ATR (14 RMA x2) – This indicated that the stop loss is determined by the ATR. The x2 is the ATR Factor. If ORB is selected, then the first line will show SPREAD, instead of ATR.
2. Capital – This is your total capital or capital at risk.
3. Risk X% of Capital – The amount you’re risking on a % of the Capital. If a Custom Risk Amt is entered, then Risk Amount will be shown in place of Capital and Risk % of Capital.
4. Entry – The current price.
5. Stop Loss – The stop loss price.
6. -1R – The stop loss price and the amount that will be lost of the stop loss is hit.
7. – These are the target prices, or levels where you will want to take profit.
This script is primarily meant for people who are new to active trading and who are looking for a sound risk management strategy based on market volatility . This script can also be used by the more experienced trader who is using a similar system, but also wants to see it applied as an indicator on TradingView. I’m looking forward to maintaining this script and making it better in future revisions. If you want to include or change anything you believe will be a good change or feature, then please contact me in TradingView.

Ravih Pro Trend BreakoutThis is a Trend Breakout Strategy on “DAILY Time-frame”
This Strategy is designed keeping in mind with Medium to Long Term traders. The strategy works only on Daily Time-frame and on Closing Price.
The concept here is to identify assets with potential change in trend. Primary focus is to position for the big move. There are times... trying to catch every trend, many of which can be unprofitable especially in side-way market. However, the primary purpose of this strategy is to catch all the major trend movements, which are much more profitable than minor market losses in all the side-way market.
I’ve simplified it to make it user-friendly.
How to use?
Set it to Daily Time-frame.
Buy, Take Profit 1,2,3 and Exit signals are included on chart based on the current Trend direction. The system shows an Exit signal if the system’s exit conditions are met. It works only on Daily Time-frame and on Closing Price.
Dark Blue Up Triangle denotes Buy at the Closing Price. Entry Price is Closing Price or with + or – 2% tolerance of the Closing Price for the following market day.
Purple Down Triangle denotes Exit to close any remaining position to free up capital.
Little Green Up Triangles denote the Bulls are in Control and Overpowering the Bears and represents minor Buying opportunities with strong probability of continuing up-moves.
Setting Up Alerts
The user has the option to Setup Alerts for all chart signals that is…
For Buy, for Exit, for Take Profit 1 set at 24%, for Take Profit 2 set at 48% and for Take Profit 3 set at 72%
The user also has the option to adjust the Take Profit as per their desire. However, the predetermined Take Profit set for this strategy does work reasonably well.
Remember...
This strategy is only built for stocks. It is Not for Indices neither for any other financial instruments.
No SHORT signals in this strategy.

Envy's Bollinger Band RSI Strategy - My First ScriptThis is an indicator that prints buy and sell signals based off the conditions that are met and this strategy itself can be really good when used correctly and do not use this when you are looking at news pair or any pairs of high volatility and this can be done through looking at the market research on the forex.com website.
This strategy uses the bollinger bands paired with RSI to determine the possible entries and when these two conditions are met, one final condition will have to be met, which is the overstretched candle, and if these are all met then the entry is valid.
Now before placing an entry if you do decide to use this strategy please follow the steps below:
Recommended Time frame: 5 Minutes
If RSI is higher or equal to 75 -> Look for sells or enter a small position to test the burst of the candle
RSI > 75 and Overstretched -> Placing sells and if the candle builds up then you can have another position that can be greater than the previous if you want to take that risk (No more than 2 or 3)
Take Profit: 5-10 pips downwards
Stop Loss: 10 pips or higher
If RSI is lower or equal to 25 -> Look for buys or enter a small position to test the burst of the candle
RSI < 25 and Overstretched -> Placing buys and if the candle falls down then you can have another position that can be greater than the previous if you want to take that risk (No more than 2 or 3)
Take Profit: 5-10 pips upwards
Stop Loss: 10 pips or higher
Tip: For extra confirmation use the one minute time frame to your leverage, if both the 1 minute and the 5 minute has their RSI to the key levels then it will be a high probability trade!
Note: Do not trade high volatility news events
The time zone to trade in: London Open - New York Closing
The script also provides you with multiple interchangeable settings that can provide you a better picture of trades and reduce noise, however this is my first script so there will be errors that will be listed below!
The dashboard will show you current RSI value, current pair, current timezone, overall trend with the 100MA and the strategy trend with the bollinger band.
Known Bugs:
-Sometimes the signals won't print depending on the bollinger band upper or lower ring and this can be fixed by lowering RSI, changing RSI source output, changing the bollinger band settings etc.
-The print text is constantly recreated after every candle that meets the conditions (mostly appears on news event pairs) and this can be annoying to see and has a lot of noise - noise can be reduced through increasing RSI Source
-The timezone on the dashboard is constantly set to New York for some odd reason

[fareid] Quick Backtest Framework█ OVERVIEW
This Framework allows Pine Coders to quickly code Study() based signal/strategy and validate its viability before proceed to code with more advance/complex customized rules for entry, exit, trailstop, risk management etc..
This is somewhat an upgraded version of my earlier personal template with different strategy used, cleaner code
and additional features.
█ USE CASES
- You have an idea for trade signal and need a quick way to verify its potential before writing lengthy/complicated code
- You found a study script for trading signal in public library and want to validate it profitability with minimum effort before including it in your trading playbook
█ FEATURES
- Alert: Ready to use alert function based on signals from your custom indicator.
- Visual Backtest: Auto-plot entry, stop-loss and take profit for simple strategy performance analysis
- Backtest Statistic: Provide basic key metrics based on backtest strategy
- BTE External Signal Protocol: Ready to use code that will supply required state to PineCoders Backtesting & Trading Engine if you wish to have more advance and sophisticated backtesting engine
Notes: All of the above features have On/Off toggle
█ Description & How To Use
This Framework consist of 5 Modules but you only need to edit the first 2 Modules:
Module1: Indicator
Module2: Framework Input Protocol
Module3: Alert
Module4: Backtest
Module5: Backtest & Trading Engine
Tips: The source-code includes collapsible block by module for easy navigating
Module1: Indicator:
-----------------------------------------------------------------------------------
Main Module. Place custom indicator input parameter/calculation/indicator plotting here
Sample Strategy: Double MACD Crossover
MACD Signal: 1st MACD Cross above signal line indicate Buy Signal
1st MACD Cross below signal line indicate Sell Signal
MACD Filter: 2nd MACD is above 0 line indicate Uptrend
2nd MACD is below 0 line indicate Downtrend
Module2: Framework Input Protocol:
-----------------------------------------------------------------------------------
Use this module to connect main indicator/signal calculated in Module1 to the rest of the framework's module
4 variables needed to be defined here:
1. Uptrend
2. Dntrend
3. BuySignal
4. SellSignal
i'm not sure how to place a code snippet here to show you example so in the source code i already put a comment in Module2 on which part u need to edit. I hope its pretty simple to use.
Module3: Alert Module Description:
-----------------------------------------------------------------------------------
As long as the variables in Module2 properly defined, the alert module is ready to use without any further modification.
Input:
Enable Alert --> Enable TV's alert and plot signal to chart
Alert Type --> Set to take Buy only, Sell only or Both alert
Module4: Backtest Module Description:
-----------------------------------------------------------------------------------
As long as the variables in Module2 properly defined, the backtest module is ready to use without any further modification.
Input:
Backtest Stat --> Enable Backtest Statistic Label
Backtest Visual --> Enable Backtest visual simulation
Backtest Type --> Set to take Buy only or Sell only or both
SL Type -->
ATR : Set SL in ATR times Multiplier below entry price
Fixed : Set SL in fixed point below entry point (in 'Dollar'). e.g. for Stocks -> 0.5 equals to 50cent while for EURUSD currency -> 0.005 equal to 50 pips
HiLo Bar: Set SL at highest/lowest wick of previous bar plus/minus Fixed point. e.g. EURUSD HiLo=3 and Fixed Point = 0.0005, buy trade will place SL 5 Pips below lowest of previous 3 bar
SL ATR Multi --> Set Lookback Period used for SL's ATR calculation
SL ATR Multi --> Set ATR Multiplier for SL
SL Fixed --> Set Fixed Level for SL
SL Bar --> Set Number of previous bar to check for SL placement
TP RR Ratio --> Set TP based on RR multiplier. e.g. 2 means TP level will be twice further from entry point compared to Entry-SL distance.
Notes: The point is for preliminary testing, so it only supports 1 trade at a time and no Trailing Stop
Module5: Backtest & Trading Engine Description:
-----------------------------------------------------------------------------------
As long as the variables in Module2 properly defined, the Pinecoders BTE module is ready to use without any further modification.
Input:
External Signal Protocol --> Set ESP State to send to "Backtesting & Trading Engine "
Signal With Filter --> Use this to send entry signal that already filtered by this study indicator (without stoploss level)
Signal Without Filter --> Use this to send raw entry signal that are NOT YET FILTERED by this study indicator (without stoploss level)
Signal and Stop With Filter --> Use this to send entry signal WITH StopLoss that already filtered by this study indicator (with stoploss level)
Signal and Stop Without Filter --> Use this to send raw entry signal WITH StopLoss that are NOT YET FILTERED by this study indicator (with stoploss level)
Notes: Backtesting & Trading Engine already have built-in Filter, Entries and Stop Level. e.g. Unselect all their filter state if only want to use custom filter and make sure send Signal with Filter (with or without SL level)
█ DISCLAIMER:
This framework main objective is to create my personal indicator template so that i just have to modify the indicator module for preliminary testing in future.
The sample strategy included are for educational purpose only. Use at your own risk
credit: LucF/PineCoders for a lot of his scripts that i use as a guide to complete this

Hullk Autobot
HULLK AUTOBOT
• Long entry positions
• Profit targets
• Stop loss targets
Description
The Fast Signal Line is an extremely fast and smooth moving average indicator, designed to eliminate
the lag typically associated with traditional moving average indicators.
When the price is trending upward the Fast Signal Line is colored light grey then turns orange when
price is trending downward.
How to Trade
It is good practice to assess multiple timeframes to ensure you are mindful of the larger picture. The
15 minute and 4-hour charts are worthy of note.
In addition to displaying the current macro trend, the Fast Signal Line can also be used for judging
entries and exits from trades.
Aggressive traders may choose to trade based on the first touch of the Fast Signal Line whereas
conservative traders may wait for the signal line to be broken and established as a line of support or
resistance before taking action.
Indicator Configuration
The Fast Signal Line’s display and colors can be changed by modifying the ‘Fast Signal’ options in
the indicator’s style settings;
Volume Line
Description
The Volume Line uses short-term historic volume data to determine the balance between demand
and supply.
When volume is supporting price the Volume Line is colored yellow then turns red when the volume is
rejecting the price.
How to Trade
While the Volume Line can indicate support and resistance levels, it is best used to confirm bias
when using the Fast Trend Line indicator to enter or exit trades and can also be used by traders for
stop-loss or take profit entries.
Indicator Configuration
The Volume Line’s display and colors can be changed by modifying the ‘Volume’ options in the
indicator’s style settings;
Trend Line
Description
The Trend Line is a Weighted Moving Average indicator based on a fixed period and is used to
identify the current trend of the market.
When supporting the price, the Trend Line is colored green then turns red when rejecting the price.
How to Trade
Timeframes of 4H and above are best used to determine the current trends, while shorter timeframes
can be used for entering and exiting trades when the trendline is turning in the relevant direction.
Indicator Configuration
The Trend Line’s display and colors can be changed by modifying the ‘Volume’ options in the
indicator’s style settings;
Whales Volume Line
Description
The Whales Volume Line uses long-term historic volume data to determine the balance between
demand and supply dictated by large/institutional traders in the market.
When volume is supporting price the Volume Line is colored yellow then turns red when the volume is
rejecting the price.
How to Trade
While the Whale Volume Line can indicate support and resistance levels, it is best used to confirm
bias when using the Fast Trend Line indicator to enter or exit trades and can also be used by traders
for stop loss or take profit entries.
Indicator Configuration
The Whales Volume Line’s display and colors can be changed by modifying the ‘Whales Volume’
options in the indicator’s style settings;
Trendline Direction Line
Description
The Direction Line is a Weighted Moving Average indicator based on a longer period than the Trend
Line and is used to identify the current direction of the market.
The Direction Line indicator is colored purple when the market direction is up trending and red when
downtrend.
How to Trade
Timeframes of 4H and above are best used to determine current trend, while shorter timeframes
can be used for entering and exiting trades when the trendline is turning in the relevant direction.
Indicator Configuration
The Trendline Direction’s display and colors can be changed by modifying the ‘Trendline Direction’
options in the indicator’s style settings;
Channel Line
Description
The Channel Line is a Least Squares Moving Average indicator based on a fixed period and is used as
a crossover signal to identify bullish or bearish trends ahead of traditional simple or exponential
moving averages.
The Channel Line indicator is colored cyan when the market direction is up trending and red when
downtrend.
How to Trade
When the Channel Line changes to an uptrend along with a recovery in price, traders can use this as a
signal to enter a long position. If the signal changes to a downtrend along with a fall in price, traders
can use this to enter a short position.
Indicator Configuration
The Channel Line’s display and colors can be changed by modifying the ‘Channel’ options in the
indicator’s style settings;
Dip & Pop Signals
Description
Dip and Pop signals occur when the price is likely to make a counter-trend movement before continuing
its direction.
In a bullish trend, a Dip signal suggests that price will move down to test support before continuing,
whereas a Pop signal suggests that price will move up. In a bearish trend, a Pop signal suggests that
price will move up to test resistance before continuing, whereas a Dip signal would suggest price is
likely to continue the trend.
How to Trade
Dip and Pop signals should be used as notification for preparation rather than a call to action as the price
can move unpredictably during volatility.
Indicator Configuration
The Dip & Pop’s display and colors can be changed by modifying the ‘PoP’ & ‘DIP’ options in the
indicator’s style settings;
Entry & Exit Signals
Description
Entry and Exit Signals are indications of when to open and close trades but should be used in
conjunction with other indicators to interpret their meaning.
How to Trade
While Entry and Exit signals can be interpreted as simple long and short entries, their meaning does
change based on trend circumstance. An Entry signal is typically printed price is starting to see a
positive reaction after a drop.
When the Fast Signal, Trend, and Trend Direction lines are indicating an upward trend an Entry signal
signifies a good place to enter a long or exit a short position. However, if the lines are not suggesting
an upward trend then a long signal indicates that any long order should be exited as any new long
orders in this scenario are risky as you would be opening a position at resistance.
Likewise, when indicator lines are indicating a downward trend and an Exit signal is received this
signifies a good place to enter a short or exit a long position. However, if the signal is against the
trendlines then this is a riskier short into support.
Indicator Configuration
The Entry & Exit’s display and colors can be changed by modifying the ‘Entry’ & ‘Exit’ options in the
indicator’s style settings;
If you have any questions or are looking for access please send me a private message.
Thx for your time and support

DMT 369 DRAGRONFLY StudyDragonfly Study version plus statistics panel
Successful traders trade with a fixed plan and without emotion, but this a lot harder than many new traders think. Many never master this skill and suffer continual drawdowns on their accounts as they overtrade high leverage positions in volatile markets.
ĐΜŦ Autobot resolves this issue by taking the human element out of the equation, allowing full automation of trades using TradingView alerts to trigger your favourite trading bot, such as Alertatron or 3Commas.
Being a Trend Reversal Indicator based on Volatility & Average True Range , ĐΜŦ Autobot is designed to identify spots in the market that offer suitable scalp and swing trade opportunities.
Due to popular demand we have expanded our ĐΜŦ Autobot product line to include the new ĐΜŦ Autobot Dragonfly 3-6-9 Edition which combines DMT with 3-6-9 Vortex mathematics, our Titan indicator and a multi-ladder scalping strategy to ensure you maintain a preferable average entry when price action moves against your position.
Indicator View
It its default state the DMT Autobot Dragonfly indicator displays key signal information, such as:
• Support & resistance range lines
• Titan Body Small & Large Time Frame lines
• Long & Short entry positions
• Long & Short position ladders
• Profit targets
Dragonfly displays a range between resistance (upper line) and support (lower line) on the chart.
Once the price is granted support in the range the lower line will turn green. As price action develops it will make repeated attempts to test support. If support holds price will attempt to test the resistance line (red).
When resistance is broken and the price is above the upper line, the line will turn blue confirming the bullish momentum and provide a potential buy opportunity.
Price action will make attempts to test the upper line as support and will keep rising while support is granted.
Once support is lost the upper line will become red once more. As price action develops it will make repeated attempts to test resistance. If resistance holds, the price will attempt to test the support line (green).
When support is broken and the price goes below the lower line, the line will turn red confirming the bearish momentum and provide a potential selling opportunity.
Price action will make attempts to test the lower line as resistance and will keep dropping while resistance is granted.
Titan Body
The Titan Body Small & Large time frame options in the indicator add additional trendlines to the chart to provide further clarity and confirmation to the Support & Resistance range indication.
Once price is granted support by the Small Time Frame trend line the line will turn green. As price action develops it will make repeated attempts to test the Small Time Frame support. Once the price is below the Small Time Frame trend line , the line will turn red and can act as resistance in a trend reversal.
When price is granted support by the Large Time Frame trend line the line will turn cyan. As price action develops it will make repeated attempts to test the Large Time Frame support. Once the price is below the Large Time Frame trend line , the line will turn orange and can act as resistance in a trend reversal.
The Titan Body enabled and customized in the indicator’s style settings,
Alert indicators
DMT Autobot Dragonfly Edition generates signals that can be used to scalp trade a volatile asset.
Signals are enabled and customized in the indicator’s input settings Additional options can be found in the options, but it is recommended that these are left at the default, as shown below. The indicator generates many
Entry and Profit levels can be disabled or customized in the indicator’s style settings,
Tradingview Alerts
Using Tradingview alerts, DMT Autobot Dragonfly signals can be used to trigger a trading bot.
To trigger a long or short position, set the Tradingview Alert Condition to DMT 369 Dragonfly and select the long or short option.
It is recommended that long or short positions are configured to trigger Once Per Bar Close
Ladders can also be triggered using alerts. To trigger a ladder order, set the Tradingview Alert Condition to DMT 369 Dragonfly and select the appropriate Long or Short ADD option that is to be triggered by the relevant values defined in the indicator’s configuration.
It is recommended that ladder orders are configured to trigger Once Per Bar,
To trigger a take profit order, set the Tradingview Alert Condition to DMT 369 Dragonfly and select the Long or Short TP option that is to be triggered by the relevant values defined in the indicator’s configuration.
Take profit orders can be configured as Once Per Bar Close or Once Per Minute.
If you wish to trigger a take profit signal immediately when the indicator’s defined take profit value is achieved, then use the Once Per Bar option.
Selecting Once Per Bar Close to generate a take profit signal is a gamble as the candle may close far away from the defined profit target – positive or negative.
While stops can be used, they are not applicable to the recommended ladder strategy.
Ladder Strategy
The DMT Autobot Dragonfly indicator always turns an underwater position into a win by utilizing a ladder strategy.
By using the recommended defaults, the indicator will trigger ladder orders at 3%, 6% & 9% using increasing order sizes,
Order sizes increase exponentially to ensure a good average price is maintained. If you are not using DMT Autobot Dragonfly signals to trigger ladder or take profit orders, please ensure your trading bot is configured to recalculate the new ladder entry and profit target based on the new average position entry price as each ladder is filled.
If you are using DMT Autobot Dragonfly on a leveraged asset, please ensure the leverage position is configured suitably so that your position is not liquidated if the price rapidly moves against you.
If u are looking for more information or access to the script please private msg me in trading view chat thx for support

BEST Exit Investment StackHello traders
💎 Access to this paid script can be requested through our website: link is in my signature and on my profile page (www.tradingview.com)
💎 This script is not a trading indicator but an exit investment indicator.
After a big move and especially when we're at All-time-high or all-time-low levels, it's really a best random guess to exit.
We designed this algorithm to give an early TOP/BOTTOM signal allowing to exit near:
the highest price of a LONG movement
the lowest price of a SHORT movement
We built this system knowing the followings:
1) Any asset moving strongly UP or DOWN will retrace at some point.
2) And the faster it goes UP/DOWN, the more violently it will retrace.
This is one of the few guarantees we have in trading - the market MUST punish the greedy investors/traders who dare never taking profit
This indicator is really amazing
📊 Performance
This is a very simple trading strategy.
It's never easy to take profit as we always fear of missing out.
Now, it's much easier and designed to:
multiply your stack
give a few trades per year only
What to do after exiting your stack?
1) Best case scenario:
You were long and exited and then it drops a lot.
The perfect scenario where we can get back in with a dollar cost average methodology or using your favorite trading indicator(s)
2) You exited but it keeps going and going
That's totally OK to take profit, this is never a mistake - repeat it an hundred times until your brain agrees with this statement.
Of course, you can re-enter using your favorite indicator(s)
Even if the scenario 2) happens, the scenario 1) should largely offset the missed-out profits.
Which asset classes?
Compatible with anything than can be held long-term.
Namely, cryptocurrencies, stocks, commodities.
⌚ Which Timeframes?
It's compatible with an hourly and a 2-hours timeframes.
We mostly use here the H2 timeframe to exit our HODL positions
🔔 Alerts
Alerts are obviously enabled for both directions
Best regards
Dave

888 BOT #alerts█ 888 BOT #alerts (open source)
This is an Expert Advisor 'EA' or Automated trading script for ‘longs’ and ‘shorts’, which uses only a Take Profit or, in the worst case, a Stop Loss to close the trade.
It's a much improved version of the previous ‘Repanocha’. It doesn`t use 'Trailing Stop' or 'security ()' functions (although using a security function doesn`t mean that the script repaints) and all signals are confirmed, therefore the script doesn`t repaint in alert mode and is accurate in backtest mode.
Apart from the previous indicators, some more and other functions have been added for Stop-Loss, re-entry and leverage.
It uses 8 indicators, (many of you already know what they are, but in case there is someone new), these are the following:
1. Jurik Moving Average
It's a moving average created by Mark Jurik for professionals which eliminates the 'lag' or delay of the signal. It's better than other moving averages like EMA , DEMA , AMA or T3.
There are two ways to decrease noise using JMA . Increasing the 'LENGTH' parameter will cause JMA to move more slowly and therefore reduce noise at the expense of adding 'lag'
The 'JMA LENGTH', 'PHASE' and 'POWER' parameters offer a way to select the optimal balance between 'lag' and over boost.
Green: Bullish , Red: Bearish .
2. Range filter
Created by Donovan Wall, its function is to filter or eliminate noise and to better determine the price trend in the short term.
First, a uniform average price range 'SAMPLING PERIOD' is calculated for the filter base and multiplied by a specific quantity 'RANGE MULTIPLIER'.
The filter is then calculated by adjusting price movements that do not exceed the specified range.
Finally, the target ranges are plotted to show the prices that will trigger the filter movement.
Green: Bullish , Red: Bearish .
3. Average Directional Index ( ADX Classic) and ( ADX Masanakamura)
It's an indicator designed by Welles Wilder to measure the strength and direction of the market trend. The price movement is strong when the ADX has a positive slope and is above a certain minimum level 'ADX THRESHOLD' and for a given period 'ADX LENGTH'.
The green color of the bars indicates that the trend is bullish and that the ADX is above the level established by the threshold.
The red color of the bars indicates that the trend is down and that the ADX is above the threshold level.
The orange color of the bars indicates that the price is not strong and will surely lateralize.
You can choose between the classic option and the one created by a certain 'Masanakamura'. The main difference between the two is that in the first it uses RMA () and in the second SMA () in its calculation.
4. Parabolic SAR
This indicator, also created by Welles Wilder, places points that help define a trend. The Parabolic SAR can follow the price above or below, the peculiarity that it offers is that when the price touches the indicator, it jumps to the other side of the price (if the Parabolic SAR was below the price it jumps up and vice versa) to a distance predetermined by the indicator. At this time the indicator continues to follow the price, reducing the distance with each candle until it is finally touched again by the price and the process starts again. This procedure explains the name of the indicator: the Parabolic SAR follows the price generating a characteristic parabolic shape, when the price touches it, stops and turns ( SAR is the acronym for 'stop and reverse'), giving rise to a new cycle. When the points are below the price, the trend is up, while the points above the price indicate a downward trend.
5. RSI with Volume
This indicator was created by LazyBear from the popular RSI .
The RSI is an oscillator-type indicator used in technical analysis and also created by Welles Wilder that shows the strength of the price by comparing individual movements up or down in successive closing prices.
LazyBear added a volume parameter that makes it more accurate to the market movement.
A good way to use RSI is by considering the 50 'RSI CENTER LINE' centerline. When the oscillator is above, the trend is bullish and when it is below, the trend is bearish .
6. Moving Average Convergence Divergence ( MACD ) and ( MAC-Z )
It was created by Gerald Appel. Subsequently, the histogram was added to anticipate the crossing of MA. Broadly speaking, we can say that the MACD is an oscillator consisting of two moving averages that rotate around the zero line. The MACD line is the difference between a short moving average 'MACD FAST MA LENGTH' and a long moving average 'MACD SLOW MA LENGTH'. It's an indicator that allows us to have a reference on the trend of the asset on which it is operating, thus generating market entry and exit signals.
We can talk about a bull market when the MACD histogram is above the zero line, along with the signal line, while we are talking about a bear market when the MACD histogram is below the zero line.
There is the option of using the MAC-Z indicator created by LazyBear, which according to its author is more effective, by using the parameter VWAP ( volume weighted average price ) 'Z-VWAP LENGTH' together with a standard deviation 'STDEV LENGTH' in its calculation.
7. Volume Condition
Volume indicates the number of participants in this war between bulls and bears, the more volume the more likely the price will move in favor of the trend. A low trading volume indicates a lower number of participants and interest in the instrument in question. Low volumes may reveal weakness behind a price movement.
With this condition, those signals whose volume is less than the volume SMA for a period 'SMA VOLUME LENGTH' multiplied by a factor 'VOLUME FACTOR' are filtered. In addition, it determines the leverage used, the more volume , the more participants, the more probability that the price will move in our favor, that is, we can use more leverage. The leverage in this script is determined by how many times the volume is above the SMA line.
The maximum leverage is 8.
8. Bollinger Bands
This indicator was created by John Bollinger and consists of three bands that are drawn superimposed on the price evolution graph.
The central band is a moving average, normally a simple moving average calculated with 20 periods is used. ('BB LENGTH' Number of periods of the moving average)
The upper band is calculated by adding the value of the simple moving average X times the standard deviation of the moving average. ('BB MULTIPLIER' Number of times the standard deviation of the moving average)
The lower band is calculated by subtracting the simple moving average X times the standard deviation of the moving average.
the band between the upper and lower bands contains, statistically, almost 90% of the possible price variations, which means that any movement of the price outside the bands has special relevance.
In practical terms, Bollinger bands behave as if they were an elastic band so that, if the price touches them, it has a high probability of bouncing.
Sometimes, after the entry order is filled, the price is returned to the opposite side. If price touch the Bollinger band in the same previous conditions, another order is filled in the same direction of the position to improve the average entry price, (% MINIMUM BETTER PRICE ': Minimum price for the re-entry to be executed and that is better than the price of the previous position in a given %) in this way we give the trade a chance that the Take Profit is executed before. The downside is that the position is doubled in size. 'ACTIVATE DIVIDE TP': Divide the size of the TP in half. More probability of the trade closing but less profit.
█ STOP LOSS and RISK MANAGEMENT.
A good risk management is what can make your equity go up or be liquidated.
The % risk is the percentage of our capital that we are willing to lose by operation. This is recommended to be between 1-5%.
% Risk: (% Stop Loss x % Equity per trade x Leverage) / 100
First the strategy is calculated with Stop Loss, then the risk per operation is determined and from there, the amount per operation is calculated and not vice versa.
In this script you can use a normal Stop Loss or one according to the ATR. Also activate the option to trigger it earlier if the risk percentage is reached. '% RISK ALLOWED' wich is calculated according with: '%EQUITY ON EACH ENTRY'. Only works with Stop Loss on 'NORMAL' or 'BOTH' mode.
'STOP LOSS CONFIRMED': The Stop Loss is only activated if the closing of the previous bar is in the loss limit condition. It's useful to prevent the SL from triggering when they do a ‘pump’ to sweep Stops and then return the price to the previous state.
█ ALERTS
There is an alert for each leverage, therefore a maximum of 8 alerts can be set for 'long' and 8 for 'short', plus an alert to close the trade with Take Profit or Stop Loss in market mode. You can also place Take Profit limit and Stop Loss limit orders a few seconds after filling the position entry order.
- 'MAXIMUM LEVERAGE': It is the maximum allowed multiplier of the % quantity entered on each entry for 1X according to the volume condition.
- 'ADVANCE ALERTS': There is always a time delay from when the alert is triggered until it reaches the exchange and can be between 1-15 seconds. With this parameter, you can advance the alert by the necessary seconds to activate it earlier. In this way it can be synchronized with the exchange so that the execution time of the entry order to the position coincides with the opening of the bar.
The settings are for Bitcoin at Binance Futures (BTC: USDTPERP) in 15 minutes.
For other pairs and other timeframes, the settings have to be adjusted again. And within a month, the settings will be different because we all know the market and the trend are changing.

Cyatophilum Scalper [ALERTSETUP]This indicator comes with a backtest and alert version. This is the alert version. Its purpose is to create low timeframe and scalping strategies, by choosing from a list of built-in entry points which are described in detail below, and by configuring a risk management system to your liking.
Before diving into the entry points, I will explain the strategy and risk management settings.
These 3 settings allow to choose your strategy direction, and main behavior.
- Go Long ↗: activate or deactivate long entry points.
- Go Short ↘: activate or deactivate short entry points.
- Reversal strategy ↗↘↗↘: Activate this option will allow trades to reverse position from an opposite entry point. Keep it deactivated and trades will either wait a TakeProfit(TP) or StopLoss(SL) to be closed. When neither SL nor TP or set, this option is automatically activated.
StopLoss settings:
Both Long and Short SL can be activated and configured.
The base % price is the starting point of the stoploss, in a percentage of current price.
Trailing stop, when activated, works with 2 settings:
- % Price to Trigger: a percentage of current price the price should move in a bar to trigger a trailing movement.
- % Price Movement: the stoploss variation in a percentage of current price that moves on each bar.
TakeProfit settings:
Both Long and Short TP can be activated and configured.
The base % price is the value of the TP, in a percentage of current price.
Trailing Profit Deviation %: Percent deviation for the trailing take profit.
DCA:
DCA stands for Dollar Cost Average. The idea is to open additional orders from the base order so as to improve risk management.
These additional orders are also called Safety Orders. The indicator can handle up to 9 safety orders.
The strategy will exit either from a take profit based on percentage from base order or from a total volume percentage (Configurable in the parameters).
The steps spacing (space between each step) and safety orders volume (order size) can both scale by adding a scale multiplier.
By choosing from the base strategy dropdown menu, the indicator will generate entry points.
1. BUY SELL:
-> Low timeframes spot trading, with simple buy and sell orders.
How it works:
The indicator used is a combination of QQE (Atr based trend following indicator) and RMA 100 trendline.
I think the QQE does a great job in low timeframes because it is not impacted by the noise.
The RMA which is the moving average used in the RSI, will help giving confirmation to the entry points.
How to use:
It is meant to be used as a reversal strategy, but you can add a TP or SL if you want.
When comparing to Buy & Hold, make sure to deactivate the "Short results in the backtest" setting.
2. TREND SCALPING
-> A strategy for low timeframes trading.
How it works:
The strategy creates high volatility entries filtered by a duo convergence of adaptive trendlines (Adaptive HULL MA using the chart's resolution, Adaptive Tilson T3 using 1H resolution) and a higher timeframe (1H) RSI filter (long threshold: 70, short threshold: 40, RSI length: 10).
How to use:
Must be used on charts with a resolution smaller than 1H. Recommended: from 1m to 30m.
Must NOT be used as reversal strategy. Use it with a take profit and stop loss, and DCA if you can.
Sample risk management settings:
3. Support/Resistance BREAKOUTS
-> Trade low timeframes pivot points breakouts.
How it works:
The indicator calculates the 100 previous bars swing high and low. Any break above high or below low will trigger an entry point.
The entry is however filtered by an Adaptive Tilson T3 Trendline, an ADX 30 minimum threshold and a minimum average volume threshold.
How to use:
I recommend to click "Reversal" Strategy and set a Takeprofit target.
Find the best timeframe between 1m and 30m using the backtest version.
Example here with BTCUSDTPERP on 15m:
4. AGGRESSIVE SCALPING
-> Lots of trades in low timeframes.
How it works:
Created using Cyato AI, Higher/Lower Highs and Lows and 2 HULLMA crosses as entries, and 2 Adaptive Tilson T3 as trendfilter, a 25 ADX threshold filter and a volume filter.
How to use:
Recommended Risk Management settings: Takeprofit, Stoploss and DCA (Safety orders).
Find which timeframe work the best from 30 min and below. Should not be used above 30 min since this is the resolution for the MTF Tilson.
How to create Alerts:
Click Add alert, then select the indicator, and choose the alert for your order.
Most used alerts are "LONG ENTRY", "SHORT ENTRY" and "ALL EXITS".
You will find a description of each alert in the default alert message.
To gain access to this paid indicator, please use the link below.

BlackPika Supertrend S1Hello Reader!
This study script is based on the SuperTrend. There are some extra things added to make it able to use more efficiently. They are listed below:
1. Pullback signals: These signals indicate a pull back after a trend reversal and are the most optimum places where you can add to your existing position. They also come with Alerts !
2. Trailing Stop Loss and Take Profit: These further help to reduce the draw-down and can help you to trail profits with more granularity thus securing gains.
How to use ?
----------------
Personally I use it on major pairs on cryptocurrencies like BTCUSD . Usually after the trend flips, there will be pullbacks, You can enter a part of the position when trend reversal is confirmed. Then add more when you get a pullback. To make life simpler, alerts are added for pullback signals as well. These can help acheive good entry price. Entering at pullback signals limits your losses to a great extent, as the trend will flip on the bar close if it goes against you.
You can trade manually or you can automate. All the signals have been provided with Alerts. some signals have been grouped, to reduce the number of the alerts if you wish to.
I wish you all the luck and please comment and Like if you have any doubts.
How to gain access ?
-------------------------
1. You can dm me in trading view

trend folowing study► Description
This strategy is based on the famous turtle system and tried to stay true
to the rules within the confines of what pinescript will allow me to do.
So i have adapt that pinescript and the code to the lower timeframe which was not the system of the turtle system.
The ATR and the lookback is adapt to the lower timeframe and is reducing the risk on the trade.
This indicator is based on the study mode with alert on long, short and exits.
The turtle system, is meanly a breaking trend following study use on fix low timeframe for certain pair and in day pair that you would like.
So in other word the system is trying to catch the next big pump or dump and ride it.
So it show the next trade to take manually or even automatically and the next take profit also to set up.
The next trade is automatically recalculate so the ideal is to take the next trade when the signal is close to the market price.
► Strategy results
The result exposed on exemple are based on the reversal only. The recommanded strategy is to used the Take Profit(TP) to limit the risk on each trade.
The TP receommanded are 0,3;1;5;10% set as default but you could modify it at you own caution in the settings.
The exemple you should take profit.
The setting and the paire trade must be selected in the setting.
► Configuration
So there is a window who show you the trade in progress, and on the bottom the trade to take at the bottom.
This trade at the bottom keep changing with the time so the best is to set up a alert with long and short to keep you posted.
The paires have a specific configuration, so you will need to select the trading pair and the timeframe to execute the script.
► Vendor requirements
PM us to obtain access

Black Flamingo OverlayThe Black Flamingo indicators (Overlay, Trend and Context) are a setup of three indicators that aims to help in trading.
The Black Flamingo Overlay part aims to guide the price prediction, by informing on potential short-term reversal zones, and providing take profit lines of counter-trade.
The Black Flamingo Trend part aims to predict changes in current trend, and generate trade entry points.
The Black Flamingo Context aims to inform on trend status on higher timeframes, and is used to confirm signals made by the two others indicators
The Black Flamingo Overlay display on the chart the following components :
- A standard Bollinger bands
- A set of multi-timeframe 3D Breakers
3D Breaker is a new tool that aims to provide price target for counter-trend trades.
When a sharp move of price is done on some timeframes (1m, 5m, 15m, 1h, 4h and/or 1d), the indicator will likely start printing a 3D breaker line displayed at every lower timeframe chart.
This line is set at a target price that will very likely be touched in a short-term reversal of the trend.
Note that 3D Breakers are not a mean to predict the end of a trend, they just alert on short-time counter-trade possibility, with defined take profit price. They does not consist of entry point of a trade, but they inform that the price will likely return at this line (which can be used to predict when to close a trade).
When multiple 3D Breaker line in multiple timeframe are printed, it means that the chances of short-term reversal is greater.
There is three parameters to configure the Black Flamingo Overlay :
- Bollinger period : That's simply the period of the displayed bollinger bands
- 3D Breaker Greediness : It is a percentage of the risk the price line is computed. A high greediness will print farther price lines, that will less likely be touched. A low greedyness will print closer price lines that will have a high chances of being touched, but with a diminished expected profit.
- 3D Breaker Convergence Rate : It is a rate of convergence of the 3D Breaker Line to the close price in the time. Increase the convergence rate will make the 3D breaker Line hit by the price sooner, but with diminished expected profit. Lower the convergence rate will make the 3D breaker more horizontal, but will diminished the chance that the line will be touched soon.
This indicators is only accessible on invitation. Please contact me in PM or thisma ( fr.tradingview.com ) in order to request us an access.
[astropark] DMI/ADX strategy [alarms]Dear Followers,
today I'm happy to share with you my DMI / ADX Strategy .
It provides directional trend information, so if a bullish or a bearish trend is going to start. Statistically it works better on lower timeframes (from 5 minutes to 1 hour).
It is both a Swing and Scalping Strategy indicator , based on a simple trend following theory , good for trading FOREX, Indexes, Stocks, Commodities and Cryptocurrencies.
To help in Taking Profits, the strategy integrates 2 special other than bull/bear signals:
Overbought and Oversold RSI Signals , which appear both as darker background (the darker the color, the more the price is in overbought/oversold) and green "ob"-"tp" / red "os"-"tp" labels (they optionally pop up only on a configurable stronger overbought/oversold condition) (you can enable/disable it optionally)
Peak Profit Tracker , which resets every time a new trade starts and keeps track of price fluctuation during the trade: the message is don't be too greedy and take profits or lock them with a stoploss in profit (you can enable/disable it optionally)
You can edit many options in order to
have more/less bull/bear signals
enable/disable showing bull/bear signals
enable/disable showing RSI TP signals (you can edit RSI length, overbought (OB) and oversold (OS) levels)
enable/disable showing peak profits on each trade
The user who wants to use this strategy, especially via an automated bot, must always set a stoploss (example 150$ from entry on bitcoin ) or use a proper risk management strategy .
This is not the "Holy Grail", so use it with caution. It's highly suggested to use a proper money management .
This script will let you set all notifications you may need in order to be alerted on each triggered signals.
You can find the strategy version for backtesting here below:
Here there are some examples how this DMI / ADX strategy works on many markets:
LTC/USDT 15m
BTC/USD 15m
BNB/BTC 15m
ETH/USD 15m
GOLD (XAU/USD) 15m
GOLD (XAU/USD) 1h
FB 15m
AAPL 15m
TSLA 1h
BANKNIFTY Index 5m
NIFTY 50 Index 5m
This is a premium indicator , so send me a private message in order to get access to this script .

Reversal Algo (Zeiierman)█ Overview
Reversal Algo (Zeiierman) is an adaptive reversal and momentum detection system that helps identify hidden turning points, pressure zones, and changes in market direction. It brings together advanced modeling techniques such as dynamic volatility bands, adaptive trend tracking, and momentum-based confirmation signals into one clear, visual framework.
Unlike traditional reversal indicators that depend on static oscillators or fixed levels, this tool adapts in real time to market movement. It tracks volatility and directional flow to reveal when momentum is building, slowing down, or preparing to reverse.
Whether applied to short-term scalping, swing positioning, or macro structural validation, this tool provides an adaptive analytical environment that translates complex price dynamics into actionable context.
⚪ Why This One Is Unique
This version of Reversal Algo employs multi-domain adaptive modeling, combining envelope projection, trend inertia estimation, and contrarian equilibrium tracking within a single structure.
Its framework merges nonlinear smoothing manifolds with volatility-compensated directional phase mapping, allowing it to evolve with shifting market states rather than react to them.
Optional AI-driven optimizations enhance precision in unstable regimes by dynamically reshaping envelopes and tracking lines around localized flow curvature.
█ Main Features
⚪ Reversal Cloud
The Reversal Cloud highlights areas of potential expansion, compression, and turning points in price. It adapts to volatility by expanding when markets become unstable and tightening during periods of calm, creating a visual map of market rhythm and elasticity.
When the Cloud widens, it often signals exhaustion or increased turbulence; when it narrows, it suggests balance or an upcoming breakout.
With AI mode enabled, the Cloud automatically fine-tunes its shape to align with live price behavior, keeping its structure responsive and accurate.
⚪ Reversal Signals
Reversal Signals are designed to identify potential market turning points with precision. They combine multiple layers of price behavior—momentum shifts, directional changes, and balance-point deviations—to highlight areas where reversals are statistically more likely. To reduce false clusters, the system intelligently filters out repeated signals within a short time window.
⚪ Reversal/Exit Points
Reversal/Exit Points appear as small, color-coded dots above or below candles. They signal moments where price momentum slows or where the system detects a potential shift in directional strength. These markers are often found near short-term highs or lows, making them ideal for identifying profit-taking zones, re-entry setups, or early warnings of a possible reversal.
⚪ Trend Framework
The Trend Framework provides a clean visualization of the market’s prevailing direction. It smooths out short-term noise to reveal the core trend structure, showing when the market is expanding, contracting, or transitioning between phases.
This framework helps traders quickly see whether price action supports continuation or if the trend is weakening.
⚪ Trend Tracker Line
The Trend Tracker Line is a highly responsive trend detector that reacts quickly to shifts in momentum. It adapts dynamically to volatility, providing an accurate real-time view of directional acceleration and deceleration. This helps traders spot early changes in market tone and evaluate whether a move has the strength to continue.
When AI mode is enabled, the line automatically adjusts its sensitivity to remain stable and consistent across different market conditions.
⚪ Contrarian Bar Coloring
Contrarian Candle Coloring enhances chart readability by visually distinguishing strength from weakness. Green bars highlight areas of building upward momentum, while red bars point to potential pressure or exhaustion. The system continuously adapts its color transitions to reflect subtle momentum shifts, making it easier to recognize when the market is gaining or losing conviction.
An optional AI mode fine-tunes these transitions to match the current market rhythm, ensuring that candle coloration always reflects the underlying flow of strength and weakness.
█ How to Use
⚪ Reversal Trading
The primary purpose of the indicator is to identify reversal opportunities in the market. Reversal or contrarian trading means entering positions against the current directional move in anticipation of a fade or trend rotation. This approach often occurs in high-volatility environments, so it is important to widen your stops, reduce your initial position size, and, if appropriate, scale or average into positions carefully rather than committing all capital at once.
The Reversal Algo provides predefined Buy and Sell signals designed to highlight potential market peaks and troughs. While these signals are highly accurate, they are not meant to call every top or bottom perfectly. In a strong trending market, several reversal signals may appear consecutively before the market fully turns.
⚪ Reversal Signal + Candle Coloring
Combine Reversal Signals with Contrarian Candle Coloring for added confirmation. A practical approach is to wait for a Reversal Signal and then look for a color shift in the candles (for example, from contrarian-colored to standard candles). This color transition acts as confirmation that the active move may be losing strength and that a reversal could be underway.
⚪ Reversal Signals + Reversal Cloud
Consider taking reversal entries only when price interacts with the Reversal Cloud boundaries. The Cloud’s upper and lower layers act as dynamic resistance and support zones. When a Reversal Signal appears near or immediately after price rejection from one of these layers, it adds structural confirmation to the setup and strengthens the case for entry.
⚪ Reversal Signals + Key Levels
One of the most effective ways to trade Reversal Signals is by combining them with key price levels, such as the previous day’s high, low, or close. If price rejects one of these levels while a Reversal Signal prints simultaneously, the confluence of the two events serves as strong validation for a potential turning point.
⚪ Take Profit
The Reversal/Exit Points can function both as entry confirmations and as take-profit zones. If a Reversal Signal was missed but a new Reversal/Exit Point appears near a peak or trough, it can indicate a late-entry opportunity aligned with exhaustion behavior.
These dots are most powerful as profit-taking signals. Since they form near local highs and lows, they often mark regions of temporary imbalance where reversals are likely. When a Reversal/Exit Point forms in the opposite direction of your current position, consider taking partial profits or tightening stops to lock in gains while maintaining participation in the broader move.
█ How It Works
⚪ Reversal Cloud Engine
The Reversal Cloud defines the dynamic upper and lower boundaries of market elasticity by transforming recent price displacements into a smooth volatility field. Through multi-layered envelope modeling, it constructs a continuous topology of expansion and compression zones, revealing where directional energy accumulates or dissipates.
Calculation: Uses layered volatility envelopes that adapt to changing market speed and expansion. A built-in alignment mechanism keeps the upper and lower bands synchronized, while optional AI optimization adjusts the symmetry of the cloud based on short-term directional bias.
⚪ Trend Tracker System
The Trend Tracker isolates directional persistence by modeling angular displacement of price flow over adaptive temporal curvature. It interprets slope evolution as a continuously evolving directional vector field, capturing both acceleration and deceleration within the active regime.
Calculation: Applies adaptive slope modeling to estimate the dominant direction of price flow. The system smooths fluctuations dynamically while maintaining responsiveness to significant shifts in trend velocity. When AI mode is active, an intelligent weighting adjustment refines the tracker’s equilibrium bias for better phase synchronization.
⚪ Trend
The Trend module projects a dual-polarity directional lattice, distinguishing constructive (positive) and distributive (negative) flow environments. It defines equilibrium corridors that expand and contract with evolving trend geometry, offering visual feedback on regime strength and transition probability.
Calculation: Uses weighted directional regression to estimate upper, middle, and lower trend layers. Each structure is color-coded based on price slope and relative position, creating a continuous and easy-to-read trend map.
⚪ Contrarian Bar Coloring Engine
Contrarian bar coloring converts raw bar data into a slope-weighted momentum matrix, visually encoding thrust versus decay phases in real time. It acts as a microstructural interpreter of price inertia, identifying acceleration clusters and momentum fatigue through color transitions.
Calculation: Combines slope analysis and volatility normalization to evaluate how strong or weak each price bar is relative to its trend. The results are reflected in real-time color changes that emphasize momentum strength and fatigue.
⚪ Reversal/Exit System
Reversal and Exit Points are derived from an evolving volatility-based trail that tracks directional exhaustion and reversion potential. These markers visualize transitions in directional energy—helping traders anticipate trend slowdowns or reversal probabilities.
Calculation: Constructs an adaptive volatility trail that contracts as directional momentum weakens. A state-aware detection model identifies inflection points where pressure changes polarity, producing the plotted up/down dots that mark possible reversals or exits. This ensures that each signal dynamically reflects real-time shifts in market energy rather than static thresholds.
⚪ Reversal Signals Core
The Reversal System’s entry framework is designed for precision. It combines several layers of short-term momentum analysis into clear, directionally aligned signals. By balancing different market speeds and measuring how far the price moves from its equilibrium, it identifies high-probability areas where trends may continue or reverse.
Calculation: Implements a composite synchronization framework that aligns short-term momentum phases with equilibrium drift and directional bias. Redundant triggers are filtered out through temporal separation logic, ensuring only the most distinct and reliable signals are displayed. Adaptive thresholds adjust automatically based on volatility and trading mode, maintaining signal consistency across scalp, intraday, and swing environments.
⚪ AI-Adaptive Optimization Layer
The AI layer refines selected modules — Reversal Cloud, Trend Tracker, and Contrarian Candles — by continuously recalibrating their internal weighting curves according to volatility structure and price curvature. It acts as an intelligent stabilizer that adjusts smoothing depth, boundary stiffness, and gradient bias dynamically.
Calculation: Utilizes a Context-Aware Kernel Adjustment Engine, estimating curvature variance and phase imbalance to auto-tune envelope response. The model performs iterative self-alignment to preserve directional fidelity under rapidly changing flow dynamics.
-----------------
Disclaimer
The content provided in my scripts, indicators, ideas, algorithms, and systems is for educational and informational purposes only. It does not constitute financial advice, investment recommendations, or a solicitation to buy or sell any financial instruments. I will not accept liability for any loss or damage, including without limitation any loss of profit, which may arise directly or indirectly from the use of or reliance on such information.
All investments involve risk, and the past performance of a security, industry, sector, market, financial product, trading strategy, backtest, or individual's trading does not guarantee future results or returns. Investors are fully responsible for any investment decisions they make. Such decisions should be based solely on an evaluation of their financial circumstances, investment objectives, risk tolerance, and liquidity needs.
付费脚本

[astropark] Altwalker V2Dear Followers,
today I'm happy to share with you Altwalker V2 , an updated version of the former Altwalker for lower timeframes (from 5 minutes to 4 hours).
It is both a Swing and Scalping Strategy indicator , based on a simple trend following theory , mainly designed for Cryptocurrencies, Altcoins and of course Bitcoin.
Here you can see the Altwalker V1:
Based on Moving Average, Altwalker V2 on low timeframes dynamically identifies market resistance and support, so in which trend a cryptocurrency is during time:
green trendline and background means bullish trend , in fact it start with a "buy" signal
red trendline and background means bearish trend , in fact it start with a "sell" signal
if a series of buy and sell appears (this may happen especially in lower timeframes), this means price is in consolidation or distribution phase, so be prepared for a new trending phase coming soon, always remembering that taking profits is awesome and managing your risk by defining you position size and having a stoploss is a must in trading
To help in Taking Profits, Altwalker integrates also 2 special tools besides the trend highlighter:
Overbought and Oversold RSI Signals , which appear both as darker background (the darker the color, the more the price is in overbought/oversold) and green "ob"-"tp" / red "os"-"tp" labels (they optionally pop up only on a configurable stronger overbought/oversold condition) (you can enable/disable it optionally)
Peak Profit Tracker , which resets every time a new trade start and keeps track of price fluctuation during the trade: the message is don't be too much greedy and take profits or lock them with a stoploss in profit (you can enable/disable it optionally)
You can edit many options in order to
enable/disable showing buy/sell signals
enable/disable showing trendline
edit trendline variant (you have 2 options, by default variant 1 is selected)
enable/disable showing trend as background
enable/disable showing RSI TP signals
edit RSI length, overbought (OB) and oversold (OS) levels
enable/disable showing peak profits on each trade
The user who wants to use this strategy, especially via an automated bot, must always set a stoploss (example 150$ from entry on bitcoin ) or use a proper risk management strategy .
This is not the "Holy Grail", so use it with caution. It's highly suggested to use a proper money management .
This script will let you set all notifications you may need in order to be alerted on each triggered signals.
Here there are some examples how Altwalker V2 works on many timeframes and markets:
LINK/USDT 1h
XLM/BTC 1h
ETH/BTC 1h
ETH/USDT 1h
COMP/USDT 1h
YFI/USDT 15m
NEO/BTC 5m
VET/USDT 15m
This is a premium indicator , so send me a private message in order to get access to this script .
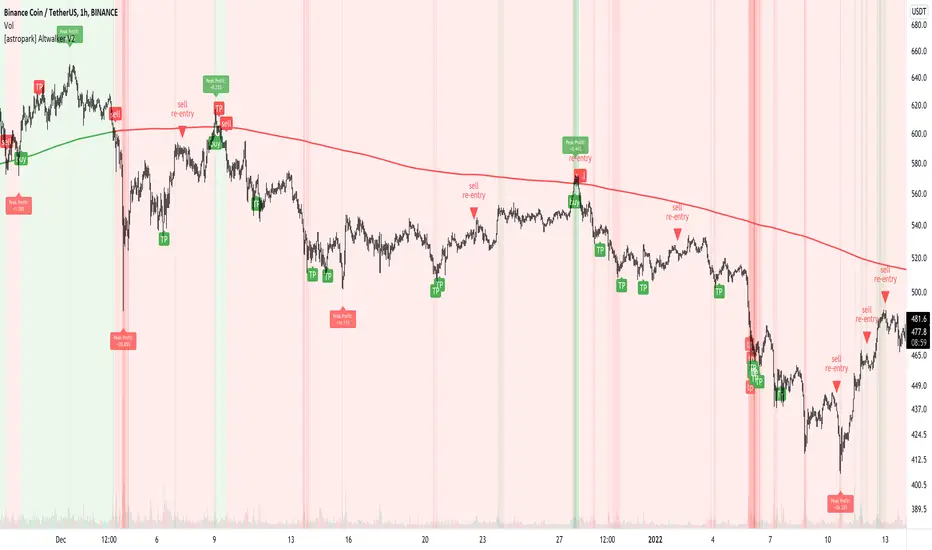
Ampleforth Rebase MACDThis script reveals Ampleforth rebase levels which are going to always work. In addition to that is MACD crossovers serving as potential buy/sell entries. You can set alerts for MACD crossovers and price entering balanced value area (0.96 - 1.06).
MACD signals can be used to automatically open a position and entering a balanced value area can be used as take-profit. Since the price will always move to this level, using this strategy without leverage should be profitable.
Ampleforth seems like a nice asset to trade since it is unlikely to correlate with anything else. At least not when it gets to the extreme levels.
GODXBTTRADING SCRIPT "GODXBT"
ALL IN ONE !!!
This script helps you to understand the market situation
Script includes
. Support & resistance tool
. 3 EMA's ( exponential moving average ) ( you can change ema values )
. Smooth Guppy : helps to understand support and resistance also helps to understand trend direction ( Red is bearish trend & Blue is bullish trend )
. And Buy & Sell signals to take entry and exit
how to trade :
Buy/Long when " BUY " signal appears
Sell/Short when " SELL " signal appears
take profits near support and resistance lines / close position on the break of it
* Customized Switches to on/off Guppy , S/R levels
* When guppy is blue longs are profitable and when red shorts are profitable
*DM for access

T3-CCI Alerts [SystemAlpha]This is an alert companion of the T3-CCI Strategy based on FX Sniper's T3-CCI indicator. Instead of using just the normal buy and sell signal, we added an option to use trend filters, trailing stop loss and take profit targets.
The TTM scalper indicator of John Carter’s Scalper Buys and Sells was originally created by HPotter and is a close approximation of the one described in his book Mastering the Trade.
In this study you have a choice of:
Trend Filters:
- Average Directional Index ( ADX ) – buy when price is trend is up and sell when trend is down.
- Moving Average (MA) – buy when price close above the defined moving average and sell when price close below moving average
- Parabolic SAR – buy when SAR is above price is above price and sell when SAR is below price.
- All - Use ADX , MA and SAR as filters
For MA Filter , you can use the “TF MA Type” and "TF MA Period" parameter to select Simple or Exponential Moving Average and length.
Stop Loss:
- Average True Range (ATR) – ATR % stop as trailing stop loss.
- Parabolic SAR ( SAR ) – Parabolic SAR adapted as trailing stop loss.
For ATR , you can use the “ATR Trailing Stop Multiplier” parameter to set an initial offset for trailing stop loss.
Take Profit Target:
- Average True Range (ATR) – ATR % stop as trailing stop loss.
- Standard % – Percent as target profit
For ATR , you can use the “ATR Take Profit Multiplier” parameter to set an initial offset for trailing stop loss.
Additional feature include:
- Show Bar Colors
Alerts:
When creating alerts use “Once Per Bar Close” parameter for Long and Short and “Once Per Bar” for Close, Trailing Stop, and Take Profit.
TradingView Links:
Strategy:
T3-CCI Indicator:
Advance ADX:
How to use:
1. Apply the script by browsing through Indicators --> Invite-Only scripts and select the indicator
2. Once loaded, click the gear (settings) button to select/adjust the parameters based on your preference.
3. Wait for the next BUY or SELL signal to enter the trade!
Disclaimer:
The indicator and signals generated do not constitute investment advice; are provided solely for informational purposes and therefore is not an offer to buy or sell a security; are not warranted to be correct, complete or accurate; and are subject to change without notice.
